Data extraction comes before the statistics software. In revisia the data from each study come out structured and linked to their source, ready for your meta-analysis. Create your free account.
## RevMan (Cochrane) RevMan (Review Manager) is Cochrane's official software for writing systematic reviews and building their meta-analyses into them. This is not a general statistics program. The whole tool is designed, from start to finish, around the Cochrane workflow: from the protocol to the characteristics of studies, risk of bias, summary of findings tables and, of course, forest plots. Its strengths: - It is built exactly for the format of a Cochrane review, with templates that guide each section. - Its forest plots are the standard you see in thousands of published reviews. - It integrates risk of bias assessment and GRADE tables. It has limitations. Its statistical range is narrower than R's (fewer advanced meta-regression methods, for example), and on price a common misunderstanding needs clearing up. The current web version, RevMan Web, is paid/subscription-based for general use, although Cochrane offers free access to authors working on a registered Cochrane review and to people in certain low-income countries. In other words, it is not freely available to everyone the way JASP or jamovi are. If your goal is to publish within Cochrane, RevMan is close to mandatory. Outside that circuit, it is rarely the most practical option. ## R + metafor (advanced) R is a free, open-source statistical programming language, and metafor is, without question, the reference package for meta-analysis in R. It is the very engine JASP and jamovi's MAJOR module use under the hood, so working directly with metafor gives you access to everything it offers without the limits of a graphical interface. With R and metafor there are hardly any limits. Fixed-effect and random-effects models, multilevel and multivariate models, complex meta-regression, sensitivity analyses, fully customizable forest plots and funnel plots, and methods to correct for publication bias (trim-and-fill, selection models). Everything stays in a reproducible script. For a serious publication that is worth a great deal. Anyone can run your code and get the same results. The price of that power is the learning curve. You need to get used to R syntax, prepare the data in the right format and understand which function to call (`rma()` for the model, `forest()` for the plot and so on). You do not need to be a professional programmer, but you do need to put in the time. R for meta-analysis is the option we recommend when the project is ambitious, when you will publish in a demanding journal or when you need a method the visual interfaces do not offer. ## Comparison table (price, learning curve, forest plot) 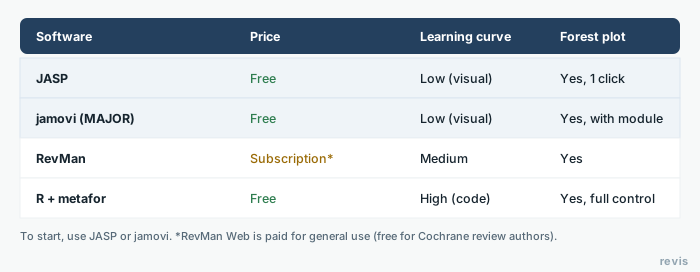 | Software | Price | Learning curve | Forest plot | |---|---|---|---| | JASP | Free (open source) | Low. Visual interface, everything through menus | Yes, in one click | | jamovi (MAJOR module) | Free (open source) | Low. Visual, easy module install | Yes, in one click | | RevMan | Paid/subscription (free only for Cochrane authors) | Medium. Built around the Cochrane workflow | Yes, standard Cochrane format | | R + metafor | Free (open source) | High. Requires coding in R | Yes, fully customizable | The table leaves a clear recommendation. If you have never run a meta-analysis, start with JASP or jamovi, which will give you correct results in an afternoon without fighting the syntax. Keep R + metafor for when you need advanced methods or full reproducibility. RevMan only pays off inside the Cochrane ecosystem. ## A forest plot in JASP, step by step The typical workflow in JASP, from start to finish: 1. Prepare the data in a spreadsheet. One row per study, with columns for the effect size (for example, the log odds ratio) and its standard error (or the raw event counts and totals per group, letting JASP calculate the effect). 2. Load the file into JASP (CSV or Excel) by dragging it into the window. 3. Open the meta-analysis module (if it does not appear, switch it on from the modules menu, the "+" icon). 4. Assign the variables to their boxes and choose the random-effects model (the usual choice when there is heterogeneity). 5. Tick the Forest plot box and, while you are at it, Funnel plot and Egger's test. In seconds you will have the plot with each study, its confidence interval and the diamond for the overall estimate at the bottom. Here is how to read it. Each horizontal line is a study. The square marks its effect (sized in proportion to the study's weight) and the line, its confidence interval. The diamond at the bottom sums up the pooled effect. To go deeper into how to interpret I², the funnel plot and effect measures, see our guide on [how to interpret a meta-analysis and its forest plot](/en/blog/what-is-a-meta-analysis/). Before combining studies, you should have assessed their [risk of bias](/en/blog/risk-of-bias-assessment/), because the quality of the studies limits the quality of the meta-analysis.Before the meta-analysis, revisia gives you the full review and the PRISMA diagram. Create your free account.
## Frequently asked questions ### Do JASP and jamovi work for reviews outside health? Yes. Both are general statistics programs and work for meta-analysis in any discipline, not only in the health sciences. ### Can I move from a visual interface to R later? Yes. jamovi can show the R code for each analysis, which makes it easier to learn and move to R with the metafor package. ### Do I need the raw data from each study or just the effect? For a standard meta-analysis, the effect size and its variability for each study are enough; you do not need individual participant data. ### What is the best free meta-analysis software? For most users, JASP and jamovi are the best free options. Both have a visual interface, are rigorous (they use the R package metafor under the hood) and let you run a full meta-analysis, with forest plot and funnel plot, without coding. If you need advanced methods or full reproducibility through code, R with metafor is the most powerful, also free, but with a steeper learning curve. ### JASP or jamovi? Both are free, open source and visual, and they share a statistical engine, so the difference is a matter of nuance. JASP stands out for its clean interface and strong Bayesian section. jamovi, with the MAJOR module, can show the equivalent R code for each analysis, which helps if you later want to move to R. Try both. The choice usually comes down to which interface you prefer. ### Is RevMan free? Not entirely. RevMan Web, the current version of Cochrane's software, runs on a paid subscription for general use. Cochrane offers free access to authors preparing a registered Cochrane review and to users in certain low-income countries. If you do not work within Cochrane, JASP, jamovi or R, which are free, are usually the better choice. ### Do I need to know R? Not to get started. With JASP or jamovi you can run a sound meta-analysis without writing a single line of code. Knowing R (and the metafor package) only becomes necessary when you need advanced models, highly customized analyses or a fully reproducible script for a demanding journal. Many researchers start with a visual interface and move to R when their projects call for it.