Analysis / Synthesis
What is a meta-analysis? How it is done and how to read one
What a meta-analysis is and how it is done. Forest plots, heterogeneity (I²), funnel plots, odds ratios and effect sizes explained with examples.
A meta-analysis is the statistical method that combines the results of several studies answering the same research question to get a single, more precise quantitative estimate of the effect. If you are asking what a meta-analysis is in plain terms, think of it as a "weighted average" of the evidence. Instead of reading ten trials one by one, you merge them into a single number (with its uncertainty) that sums up what the data say as a whole. Meta-analysis is the quantitative stage that sometimes caps a systematic review, although not every review ends in one.
Reading a meta-analysis critically takes more than checking whether the result is "significant". You need to know when it is legitimate to run one, which effect measures are used and, above all, how to interpret its two signature charts, the forest plot and the funnel plot. That is what this guide covers.
What a meta-analysis is (and when you can do one)
A meta-analysis takes the result of each study (its effect size) and weights it, usually by the inverse of its variance, so that larger and more precise studies count for more in the final estimate. The product is a pooled effect with its confidence interval.
The big advantage is statistical power. Small individual studies may be unable to detect a real effect, but once you add them up the meta-analysis can reveal it. The big trap is that combining things that should not be combined produces a precise but meaningless number (the classic "comparing apples and oranges").
That is why a meta-analysis is only defensible when:
- The studies answer a comparable question (populations, intervention and outcome similar enough).
- There is a common effect measure that can be calculated for all of them.
- There is a reasonable number of studies and the heterogeneity between them is not so high that it invalidates the summary.
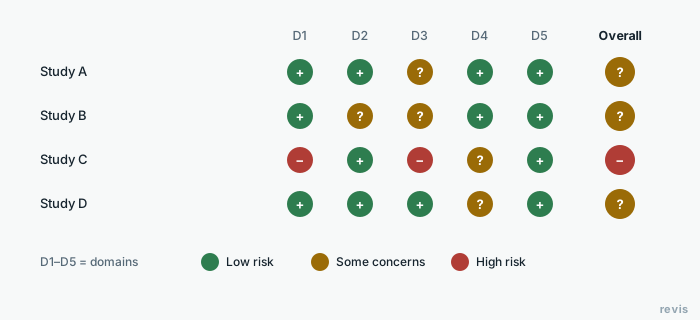
- A systematic search and a risk of bias assessment of the included studies have been done first.
If the clinical or methodological heterogeneity is excessive, do not force the calculation. Present a narrative synthesis and explain why pooling is not appropriate.
Meta-analysis vs systematic review
This is the most common mix-up, so let's pin it down. A systematic review is the complete, reproducible process of finding, selecting, appraising and synthesizing all the available evidence on a question. A meta-analysis is, optionally, the statistical technique that synthesizes the results of that review quantitatively.
| Aspect | Systematic review | Meta-analysis |
|---|---|---|
| What it is | A complete research method | A statistical technique |
| Scope | Search, screening, appraisal and synthesis | Only the quantitative synthesis |
| Always possible? | Almost always | Only if the studies can be combined |
| Result | A reasoned answer to the question | A pooled effect with its interval |
| Relationship | It is the "container" | It is one possible step inside it |
The relationship runs one way. Every rigorous meta-analysis starts from a systematic review, but not every systematic review includes a meta-analysis. To understand the whole process around this quantitative synthesis, see the guide on how to do a systematic review step by step.
Effect measures (odds ratio, risk ratio, mean difference)
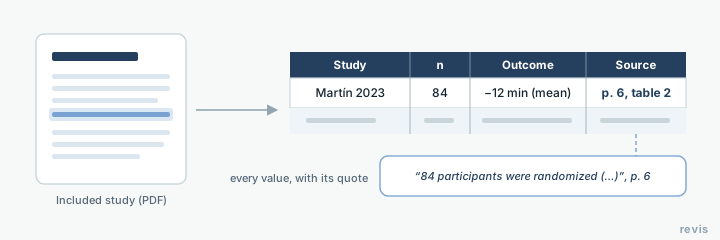
Before you combine anything, you have to choose how each study's effect is expressed (the numbers come from your data extraction table, so extract with the measure already in mind). The measure depends on the type of outcome.
For dichotomous outcomes (it happens / it does not, such as getting ill or not, surviving or not):
- Risk ratio (RR), also called relative risk. The ratio between the probability of the event in the exposed group and in the control group. An RR of 0.70 means 30% less risk; it is intuitive and widely used in cohort studies and trials.
- Odds ratio (OR). A ratio of odds (the probability that something happens divided by the probability that it does not). It is the typical measure in case-control studies and logistic regression. With rare events, OR and RR are similar; with common events, the OR exaggerates the size of the effect and should not be read as if it were an RR.
For continuous outcomes (blood pressure, a score on a scale, weight):
- Mean difference (MD). When all the studies measure the outcome in the same unit.
- Standardized mean difference (SMD). When they measure the same construct on different scales; it is expressed in standard deviations (Cohen's d is the best known).
For all of them, the "no effect" value is the reference point worth memorizing to read any meta-analysis.
| Measure | Outcome type | "No effect" value |
|---|---|---|
| Risk ratio (RR) | Dichotomous | 1 |
| Odds ratio (OR) | Dichotomous | 1 |
| Mean difference (MD) | Continuous | 0 |
| Standardized mean difference (SMD) | Continuous | 0 |
| Hazard ratio (HR) | Time to event | 1 |
The fact that the null value is 1 for ratios and 0 for differences is the key to reading the chart that comes next.
Synthesis starts long before the forest plot. In revisia you reach this stage with your studies screened, your data extracted and risk of bias assessed. Create your free account.
How to read a forest plot and its confidence interval
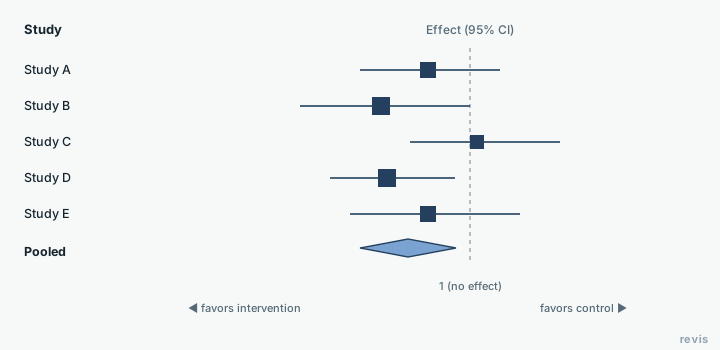
The forest plot is the standard visual display of a meta-analysis. Each row is a study; at the bottom, one row sums up the pooled effect. Learning to read it is the single most useful practical skill in this article.
Example forest plot. Each square is a study's effect estimate, its size reflects the study's weight, the horizontal lines are the confidence intervals and the diamond at the bottom is the pooled effect.
What to look at, in order:
- The square marks each study's point estimate of the effect. Its area is proportional to the weight that study contributes to the result. Bigger squares count for more.
- The horizontal line through each square is its confidence interval (usually 95%). The longer it is, the less precise the study.
- The vertical "no effect" line is the reference. It sits at 1 for OR, RR or HR, and at 0 for mean differences. If a study's confidence interval crosses that line, that study on its own is not statistically significant.
- The diamond at the bottom is the pooled effect of all the studies. Its center is the overall estimate and its width is the confidence interval for the whole set.
The reading rule is simple. If the diamond does not touch the no-effect line, the pooled effect is statistically significant; if it crosses it, you cannot rule out no effect. Also check which side of the chart the result points to, because "left" or "right" favors one group or the other depending on how the axis is labeled.
The confidence interval, in brief
The 95% confidence interval is the range of values compatible with the data. If we repeated the study many times, about 95% of the intervals built this way would contain the true effect. In practice, a narrow interval means a precise estimate and a wide one means a lot of uncertainty (typical of small studies). Do not confuse precision with size. An effect can be large and, at the same time, poorly estimated if its interval is huge.
How to measure heterogeneity with I² and Cochran's Q
Heterogeneity is the variability between study results beyond what you would expect from chance alone. It is the central question of any meta-analysis. Are the studies measuring "the same thing", or am I averaging different things?
Two statistics are mainly used to quantify it:
- Cochran's Q. A hypothesis test of whether the differences between studies are larger than chance would explain. Its problem is power. With few studies it barely detects real heterogeneity, and with many it flags heterogeneity even when it is trivial. So do not base the decision on its p-value alone.
- I². It expresses the percentage of total variability that is due to real heterogeneity rather than sampling error. It is the most cited indicator because it depends less on the number of studies. The table below gives a rough guide, taken from the Cochrane Handbook.
| I² value | Rough interpretation |
|---|---|
| 0% to 40% | Might not be important |
| 30% to 60% | May represent moderate heterogeneity |
| 50% to 90% | May represent substantial heterogeneity |
| 75% to 100% | Considerable heterogeneity |
These ranges overlap on purpose. I² is read together with the clinical context and the direction of the effects, not as a rigid threshold. A high I² does not automatically invalidate the meta-analysis, but it forces you to act.
What should you do about substantial heterogeneity? You can look for its causes through subgroup analysis (by population type, dose, study quality) or meta-regression, use a random-effects model (next section) or, if the variability cannot be reconciled clinically, give up on the pooled effect and present a narrative synthesis of the studies. What you must never do is ignore a high I² and present the summary as if the studies were interchangeable.
Fixed-effect vs random-effects models
The choice of model determines how studies are weighted and what exactly the pooled effect means.
The fixed-effect model assumes there is a single true effect shared by all the studies and that the differences between them come only from sampling error. Under that assumption, studies are weighted by their precision alone (large studies dominate). It is defensible when the studies are very similar and heterogeneity is practically zero.
The random-effects model assumes the true effect can vary from one study to another (because of differences in populations, settings or protocols) and that those effects are distributed around a mean. It builds the between-study heterogeneity into the calculation, which widens the confidence interval of the result and gives relatively more weight to small studies. It is usually the default in biomedicine, because it is rarely realistic to assume an identical effect in every setting.
| Criterion | Fixed effect | Random effects |
|---|---|---|
| Assumption | A single true effect | The effect varies between studies |
| What it estimates | That common effect | The mean of the distribution of effects |
| Study weights | Precision only | Precision + between-study variance |
| With heterogeneity | Not very appropriate | More appropriate |
| Resulting interval | Narrower | Wider (more conservative) |
As a practical rule, decide a priori based on the assumptions, not after the fact by picking the model that gives the result you like best. If there is noticeable heterogeneity, the random-effects model is almost always the honest choice.
Publication bias and the funnel plot
Publication bias is the tendency for studies with positive or statistically significant results to be published more often, sooner and in more visible journals than "negative" studies. If your meta-analysis only finds the published studies, it may be systematically overestimating the effect. It is one of the most serious threats to the validity of any synthesis, and it is related to other biases covered in the guide to risk of bias assessment.
The graphical tool for exploring it is the funnel plot. It plots each study's effect size (horizontal axis) against its precision (vertical axis, usually the standard error). The logic:
- Large, precise studies sit at the top and cluster near the pooled effect.
- Small, less precise studies spread out at the base.
- Without bias, the points form a symmetrical inverted funnel around the effect.
An asymmetrical funnel (a "gap" in the lower corner where the small studies with unfavorable results should be) is the classic warning sign of publication bias. To go beyond visual inspection, statistical tests of asymmetry such as Egger's test are used.
Two important caveats. A funnel plot is only informative with enough studies (roughly ten or more), and asymmetry is not always publication bias. It can also come from heterogeneity, from smaller studies being of lower quality or simply from chance. It is a lead to investigate, not a verdict.
Which software to use
You do not need to code from scratch to run a meta-analysis. Effect measures, weighting, I² and the plots are produced by dedicated tools, from free point-and-click interfaces to R packages. For a practical comparison of the options (JASP, jamovi, Cochrane's RevMan and the R package metafor), with their pros, cons and which to pick for your level, see the dedicated guide to meta-analysis software.
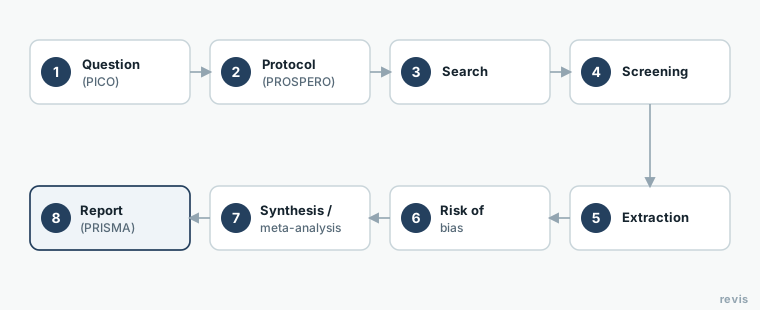
Once you have the pooled effect, remember that the meta-analysis is part of a review's synthesis. When you report it, the number of studies synthesized must match your PRISMA flow diagram, while the effect, its interval and I² go in the results section of the report.
Before the meta-analysis comes the whole review. In revisia you do it from start to finish. Create your free account.
Frequently asked questions
How many studies do you need for a meta-analysis?
There is no fixed minimum. Two studies are technically enough, but with very few studies the estimate is unstable and caution is in order.
What is an effect size?
It is the measure that quantifies the size of a difference or association (for example, an odds ratio, a risk ratio or a mean difference), not just whether it is significant.
When should you not do a meta-analysis?
When the studies are too heterogeneous in population, intervention or measurement. In that case the synthesis is done narratively.
What is the difference between a meta-analysis and a systematic review?
A systematic review is the complete, reproducible process of searching for, selecting, appraising and synthesizing all the evidence on a question. A meta-analysis is only the statistical technique that combines the results of those studies quantitatively into a single effect. Every rigorous meta-analysis starts from a systematic review, but not every systematic review includes a meta-analysis. If the studies cannot be combined, the synthesis is done narratively.
What does a high I² mean?
A high I² (roughly, above 50-75%) means that a substantial part of the variability between study results comes from real heterogeneity, not chance. In practice it suggests the studies may not be measuring "the same thing". It does not automatically invalidate the meta-analysis, but it forces you to investigate the causes (subgroup analysis, meta-regression), to use a random-effects model or, if the heterogeneity cannot be reconciled, to give up on the pooled effect.
How do you read a forest plot?
Each study is a row with a square (its effect, with an area proportional to its weight) and a horizontal line (its confidence interval). The diamond at the bottom is the pooled effect. The key is the vertical line of "no effect", at 1 for odds ratios and risk ratios and at 0 for mean differences. If a study's interval (or the final diamond) crosses that line, the result is not statistically significant; if it does not touch it, it is.
What is a funnel plot?
A funnel plot is used to explore publication bias. It plots each study's effect size against its precision. Without bias, the points form a symmetrical funnel around the pooled effect. Asymmetry (a gap where the small studies with unfavorable results should be) suggests that negative studies are missing because they were never published. Asymmetry is checked with tests such as Egger's test, and it can only be interpreted with enough studies.