Reporting / Reporting
PRISMA 2020 flow diagram: free generator, template and guide
Make your PRISMA flow diagram for free, no account needed. What PRISMA is, how to fill in each phase, the editable Word template and the 27-item checklist.
The PRISMA flow diagram is the chart that shows how many records you identified, how many you screened, how many you excluded and why, and how many studies ended up in the synthesis. It is the most recognizable part of the PRISMA statement and the part reviewers look at first, because those numbers show whether the selection can be reproduced.
How you get yours depends on where you are:
- Your review is done and you only need the drawing. Use our PRISMA 2020 flow diagram generator. You type your numbers, watch the diagram update as you type and download it as PDF, SVG, PNG or Word. It is free and needs no account. Downloads carry a small revisia mark in the corner, which goes away if you sign in. Ten minutes and you are done.
- You are just starting the review. Then it pays to run the review in revisia, because the diagram builds itself from the real counts of your screening. You never copy a number by hand, so the counts always add up.
The rest of this article covers what PRISMA is, what changed in 2020, what goes in each box of the diagram and how the 27-item checklist fits in. If you want the full process, this article is part of our guide on how to do a systematic review step by step.
What the PRISMA statement is
PRISMA stands for Preferred Reporting Items for Systematic Reviews and Meta-Analyses. It is not a method for doing a review. It is a standard for reporting what you did. The difference matters. PRISMA does not tell you how to design the search or how to analyze the data. It tells you what information to include so any reader can understand, assess and reproduce your work.
The PRISMA statement appeared in 2009 as the successor to the QUOROM guideline. Today most scientific journals that publish systematic reviews require it. When a journal asks for your manuscript to "follow PRISMA", it means two things:
- The PRISMA checklist, with the items the text of the article must contain (title, structured abstract, methods, results and so on).
- The PRISMA flow diagram, the visual outline of the study selection process, which sums up in numbers the whole path from identification to inclusion.
What readers get from PRISMA is the ability to see how many studies came in and went out at each step, and to repeat the process if they want to check it. For you, following it is in practice a condition for publishing in indexed journals and a quality criterion when undergraduate theses, master's dissertations and PhD theses are graded.
A common mix-up is treating PRISMA as an assessment of study quality. Reporting in line with PRISMA is separate from judging the risk of bias of the included studies, which you do with dedicated tools such as RoB 2 or AMSTAR 2. A review can be perfectly reported under PRISMA and still include low-quality studies. PRISMA only ensures you report what you did, not that what you did was good.
PRISMA 2020 vs PRISMA 2009 (what changed)
PRISMA 2020, the update that replaces the 2009 version, was published in 2021. It came because review methods had changed over those ten years. Teams search in more places, use automation tools and are expected to document better why each study was excluded.
These are the changes to know before you pick your template.
| Aspect | PRISMA 2009 | PRISMA 2020 |
|---|---|---|
| Checklist items | 27 items | 27 items (rewritten, with more detailed sub-items) |
| Diagram phases | Identification, screening, eligibility, included (4 boxes) | Identification, screening, included (3 phases) |
| Sources of records | A single entry path | Separate paths for databases, registers and other sources (websites, citation searching, contacting authors) |
| Documenting exclusions | Generic | Detailed reasons for exclusion at full-text screening |
| Abstract | Recommended | A dedicated abstract checklist (PRISMA for Abstracts) |
| Automation | Not addressed | Distinguishes between screening by humans and by automation tools |
The most visible change is in the structure of the diagram. PRISMA 2009 used four labels (identification, screening, eligibility, included), and PRISMA 2020 regroups them into three phases (identification, screening, included). Above all, it splits the sources of records into two columns. The diagram comes in four variants, depending on whether it is a new review or an update and whether the search covered only databases and registers or other methods too.
Unless a journal asks for the older version, use PRISMA 2020. It is the current one and the one reviewers expect in 2026.
The PRISMA flow diagram step by step
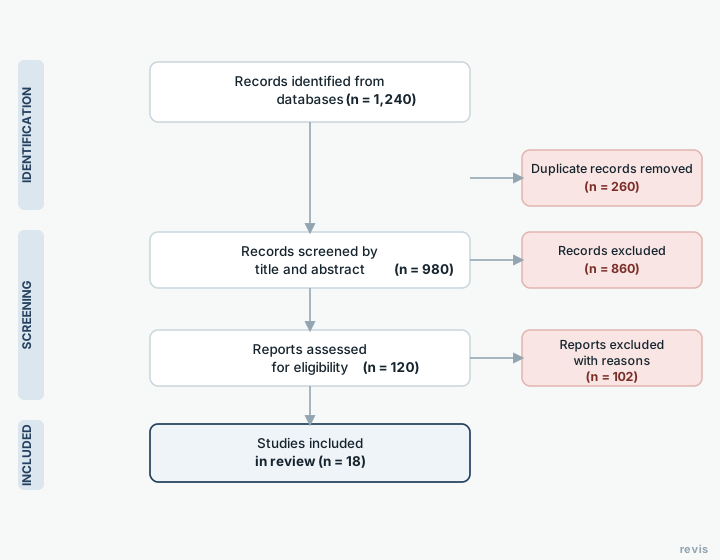
The PRISMA 2020 flow diagram is organized in three phases, each with its own boxes and counts. Keep your tally sheet at hand. Every number in the diagram must be traceable to a real record in your reference manager or your screening tool.
Phase one, identification
Here you record everything you retrieved, before you look at anything in detail.
- Records identified from each database and register searched (PubMed, Scopus, Web of Science, Cochrane and so on), added together. Report the total and, if your template allows it, the breakdown by source.
- Records identified from other methods. Organization websites, reference lists of included studies, contacting authors or hand searching. In PRISMA 2020 these go in a separate path.
- Duplicate records removed before screening. This is the number reviewers audit most, so document how you found them (by hand or automatically with your reference manager).
Phase two, screening
This phase has two sub-steps, and it is where most exclusions happen.
- Records screened on title and abstract. This is the total after removing duplicates.
- Records excluded at title and abstract screening. A number is enough here (detailed reasons are not required, because these records are usually plainly irrelevant).
- Reports sought for retrieval. The records that passed the first filter and for which you tried to get the full text.
- Reports not retrieved. Those whose full text you could not get (no access, no reply from the author and so on).
- Reports assessed for eligibility in full text.
- Reports excluded at full text, with reasons. This is the requirement PRISMA 2020 tightened. Every exclusion at this stage carries its reason, for example "wrong study design, n=12", "different population, n=8" or "language, n=3". This is where your inclusion and exclusion criteria turn into justified numbers.
Phase three, studies included
- Studies included in the review and the number of reports linked to those studies (one study can have several publications). This is the number that feeds the qualitative synthesis and, where appropriate, the meta-analysis. If yours looks small, check the data on how many studies a review usually includes. The typical Cochrane review includes six.
For the diagram to add up, at every step the records that come in minus those excluded must equal those that move on. If the counts do not match, fix them before you submit. Reviewers check them with a calculator.
With the numbers in front of you, the drawing takes ten minutes. Our PRISMA 2020 flow diagram generator is free, needs no account and warns you when two counts contradict each other. Make my PRISMA diagram.
How to make a PRISMA diagram for free (without drawing anything)
Drawing the diagram by hand in Word is the slow way to do it, and the one that leaves the most counting errors. If you already have your numbers, these are the three routes, from most to least convenient.
Our free generator works in the browser with no account
Make a PRISMA diagram is the tool we built for this. You type the counts and the diagram appears as you type, so you see the result before you commit to anything. It needs no sign-up and costs nothing. Downloads carry a small revisia mark in the corner, which goes away if you sign in.
What it does for you:
- It checks the arithmetic. If the records screened do not match the records identified minus duplicates, or if the reasons for exclusion do not add up to the reports excluded, it tells you which number contradicts which. It warns, it does not block. Some gaps have a legitimate explanation, and sometimes you want to save a half-finished diagram.
- It includes the four official PRISMA 2020 templates. New review or update, with or without the column for other methods. You switch between them with a drop-down and a checkbox, without redoing anything.
- It exports to PDF, SVG, PNG and Word. PDF or SVG when the journal asks for vector artwork, PNG at 4x when the submission system wants a high-resolution image, and Word to embed the figure in the manuscript.
- It speaks two languages. The labels come out in English or Spanish, depending on what your journal or university asks for. Both use the wording of the published PRISMA 2020 standard.
- It does not upload your data anywhere. Everything happens inside your browser. Your counts never travel to our servers or anyone else's.
- It reads and writes the CSV format of the PRISMA2020 R package, in case you work with that tool or want to keep the numbers separately.
The official PRISMA2020 app (Shiny and R package)
The team behind the statement built it. You enter the numbers into a template and it generates an interactive diagram you can export to PDF, PNG or an editable format. It is free and the closest to the official version. If you already work in R, you will have no trouble with it. If you do not, the interface is designed for people who do, and it shows.
The Word or PowerPoint template
It is still useful when your journal or university gives you its own template and you need to match its design. It is the manual route, so you check the arithmetic yourself. It is covered in the next section.
None of the three makes up numbers. The diagram reflects your data, so what decides its quality is screening that is well documented from day one. If you have not reached that point yet, jump to the last section.
PRISMA flow diagram template (Word / editable)
If you prefer the manual route, the most practical start is a PRISMA flow diagram template in Word (or PowerPoint) with the boxes already drawn, where you only replace the numbers and the reasons for exclusion with your own.
The official templates are on the statement's own website: PRISMA 2020 flow diagram templates in Word, free, editable and licensed under CC BY 4.0 (which lets you adapt them as long as you credit the source). They include:
- The full PRISMA 2020 flow diagram with the three phases (identification, screening, included) and the two source paths.
- Boxes with the "(n = )" placeholder in each count, so you know which number goes where.
- One version for new reviews and another for updated reviews.
- Variants with and without the "other methods" path, depending on how you ran the search.
To fill it in, download the Word version, replace each "(n = )" with your final counts and delete the boxes that do not apply. The official templates are in English, so the box labels already use the wording English-language journals expect. The PRISMA 2020 27-item checklist is a separate download on the same website.
Rather not edit boxes by hand? Our PRISMA flow diagram generator offers the same four templates, checks that the numbers add up and exports to Word too, free and with no account.
Fill in the template at the end, once you have the final counts from your reference manager and your screening tool. Doing it before screening is closed almost always means doing it again.
PRISMA 2020 checklist (27 items)
The PRISMA 2020 checklist makes sure the text of your article reports everything it needs to. It is organized in seven sections that follow the usual structure of a scientific article. These are the 27 items, grouped.
Title (item 1)
- Title. Identify the report as a systematic review.
Abstract (item 2) 2. Abstract. A structured abstract following the PRISMA 2020 for Abstracts checklist.
Introduction (items 3-4) 3. Rationale (what is already known and the gap you fill). 4. Objectives, ideally with a question in PICO format.
Methods (items 5-15) 5. Eligibility criteria. 6. Information sources (databases, registers, dates). 7. A complete, reproducible search strategy. 8. Selection process (who screened, how many reviewers, which tools). 9. Data collection process. 10. Data items. 11. Study risk of bias assessment. 12. Effect measures. 13. Synthesis methods. 14. Reporting bias assessment (for example, publication bias). 15. Certainty assessment (for example, GRADE).
Results (items 16-22) 16. Study selection (this is where the flow diagram goes). 17. Study characteristics. 18. Risk of bias in studies. 19. Results of individual studies. 20. Results of syntheses. 21. Reporting biases. 22. Certainty of evidence.
Discussion (item 23) 23. Discussion. Interpretation, limitations and implications.
Other information (items 24-27) 24. Registration and protocol (for example, in PROSPERO). 25. Support (funding). 26. Competing interests. 27. Availability of data, code and other materials.
Notice that item 16 is where the PRISMA flow diagram fits. The diagram does not replace the checklist, it complements it. The checklist covers the text; the diagram covers the numbers of the selection process.
If you have not started your review yet
Everything above assumes you already have the numbers and only need the drawing. If you are still at the start, there is a route that saves you that whole job.
The counts in the diagram are not new data. They are the output of your screening. The trouble is that almost nobody records them while screening, so at the end they have to be rebuilt by hand, counting in the reference manager and in the spreadsheet. That is where counts that do not add up come from.
In revisia, screening and the diagram are the same thing. Every decision you make is recorded, and the PRISMA flow diagram is built from those real counts. You do not copy a single number, you do not rebuild anything at the end, and the counts add up because they come from the process itself. You also get the 27-item checklist.
Start the review and get the diagram done for you. In revisia the PRISMA diagram comes from your own screening, with nothing to fill in by hand. Create your free account.
Frequently asked questions
How many phases does the PRISMA 2020 flow diagram have?
The three phases are identification, screening and included, with the record counts at each step and the exclusions with their reasons.
What is the difference between PRISMA 2009 and 2020?
PRISMA 2020 updated the checklist and the diagram to reflect searches across several sources and to report the reasons for exclusion more clearly.
Can the PRISMA diagram be generated automatically?
Yes. With the numbers in hand, our generator draws it for free with no account and checks that the counts do not contradict each other. If you are still screening, in revisia the diagram builds itself from the counts of your own screening, without you typing a single number.
What is PRISMA in a systematic review?
PRISMA is the international guideline for reporting a systematic review and meta-analysis transparently. It has a 27-item checklist (what the text must contain) and a flow diagram (the outline of the study selection process). It is not a method for doing the review but a standard for presenting it transparently, and most scientific journals require it.
How do you make a PRISMA flow diagram?
You fill it in once selection is finished, going through the three phases of PRISMA 2020. Under identification you record the records retrieved from each database and from other sources, and the duplicates removed. Under screening you record the records screened, those excluded on title and abstract, and the reports assessed in full text (with the reason for each exclusion). Under included you give the final number of studies. The fastest route is to type those numbers into a PRISMA flow diagram generator, which draws the boxes and checks that the counts add up at every step.
Where can I download the PRISMA template in Word?
The official template is a free Word download from prisma-statement.org, with versions for new and updated reviews (CC BY 4.0 license). If you want the diagram already built with your numbers, our generator also exports to Word, and it warns you if any count does not add up.
Is PRISMA mandatory?
PRISMA is not a legal requirement, but in practice it works like one. Most scientific journals that publish systematic reviews require authors to follow PRISMA and ask for the completed checklist as supplementary material, and examiners of undergraduate theses, master's dissertations and PhD theses use it as a quality criterion. Reporting in line with PRISMA 2020 is today the sensible default for any systematic review.